Landslide Mapping Using Artificial Intelligence in the Himalayas
Background
The awe-inspiring Himalayas, despite their beauty, face a constant threat: landslides. Steep slopes, heavy rainfall, and weak geology make them vulnerable. Deforestation and development worsen the risk. These landslides, like the devastating 2014 Jure event (Nepal), can be unpredictable and wipe out entire villages. Earthquakes, like the 2015 Nepal earthquake, trigger hundreds more, hindering rescue efforts. Here, rapid and accurate landslide assessment is crucial. This article explores how combining remote sensing and artificial intelligence can streamline landslide mapping in the Himalayas.
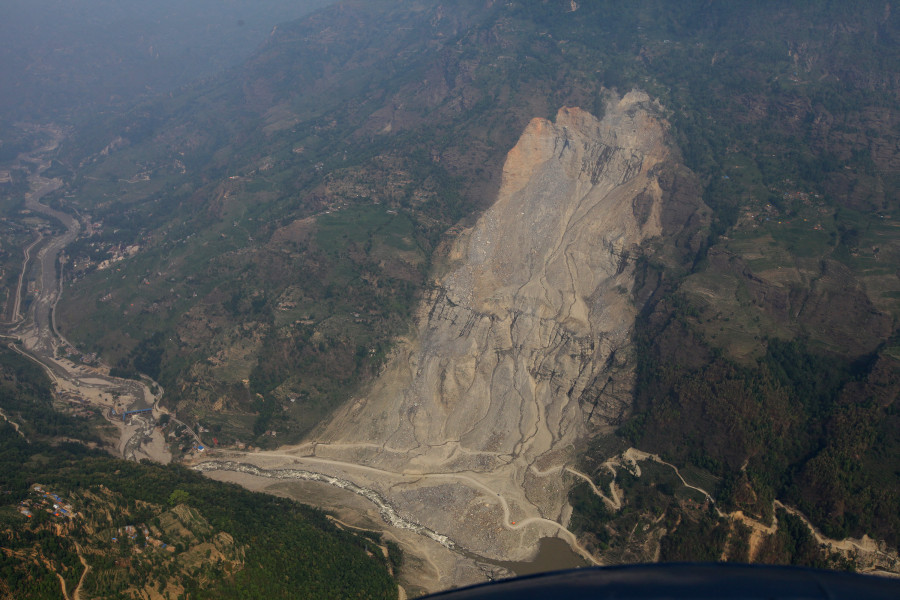
Figure 1: View of the Jure Landslide, one of the most devastating landslides that occurred in the Himalayas. Source: The Kathmandu Post
Harnessing the potential of remote sensing and artificial intelligence
Freely available remote sensing datasets from satellites like Landsat and Sentinel have revolutionized landslide monitoring. Researchers have successfully harnessed these images to map landslides (Moine et al., 2009), proving them to be a crucial source of information for hazard mapping . The ever-growing availability of these remote sensing data and powerful computing resources has opened a new frontier in landslide detection. Artificial intelligence (AI) models are revolutionizing how we identify and monitor landslides, offering significant advantages over traditional methods. Traditionally, landslide detection relied heavily on human expertise to identify subtle features in satellite imagery, such as unusual ground patterns or changes in vegetation cover. This process is time-consuming and prone to human error. AI models, however, can be trained on vast datasets of labeled landslide images. These models can then automatically learn and extract these subtle features, significantly reducing the time and human intervention required for analysis.
Leveraging Community Datasets
Deep learning models is a supervised task and hence require labeled training data for image classification. Several publicly available datasets, such as Landslide4Sense and the High-Resolution Global Landslide Detector Database (HR-GLDD) can be leveraged for this purpose. These regional datasets provide a valuable resource to train models that can then be applied to the unique challenges of landslide detection in the Himalayas, such as complex terrain and diverse vegetation cover. By leveraging a globally trained model and testing it with local Himalayan data, we can assess the model’s ability to adapt to regional variations while still benefiting from the broader landslide features learned from the globally distributed dataset.
Landslide4Sense Dataset
The Landslide4Sense dataset is designed for training deep learning models for automatic landslide detection using remote sensing data. The dataset comprises regionally distributed image patches [128x128 pixels] shown in Figure 2, each integrating multispectral data (Sentinel-2 bands 1-12) with slope and elevation data (ALOS PALSAR bands 13-14). This comprehensive data allows training models on a large scale and testing their ability to generalize to new areas (spatial transferability).
Figure 2: Geolocations of the selected case study areas plotted on a global landslide susceptibility map. Source: Ghorbanzadeh et al. (2022)
Model Setup
Out of 14 bands provided in Landslide4Sense dataset, we used only 5 bands [RGB-NIR, Slope and Aspect] which have been widely used to map landslide. Landslide4Sense provide 3799 labelled dataset. We used some data augmentation technique like flip, rotate to increase the dataset and then divide the dataset into training and testing set by 80% and 20% respectively. Our hypothesis is that data augmentation may help to improve the model performance.
The basic framework of the model including code is obtained from here. This U-Net model is designed for image segmentation and features a contraction and expansive path. The contraction path consists of convolutional layers with increasing filter sizes (16 to 256 filters), ReLU activation, dropout, and max-pooling for downsampling. The expansive path uses upsampling and skip connections for high-resolution details. The model uses Adam optimizer, binary cross-entropy loss, and sigmoid activation in the final layer for binary outputs. It monitors performance using metrics like F1 score, precision, and recall.
We used a default low learning rate of 0.001, which may require more epochs for effective training. Therefore, we increased the total epochs to 500 to see if this increases the model performance.
Model Evaluation
Figure 3 displays the performance of U-Net models for landslide prediction, with and without data augmentation. U-Net model for landslide prediction performs better with data augmentation. While the training F1-score is slightly lower (0.8324 vs 0.8714), the validation F1-score (0.7224) is closer to the training score compared to the non-flipped model (0.7097). This indicates the flipped model generalizes better to unseen data. Additionally, the flipped model has a lower validation loss (0.02617) suggesting it learns the patterns more effectively. This suggests data augmentation with flipping helps your model perform better on real-world landslide prediction.
Figure 3: Training and validation evaluation matrices. The evaluation metrics for validation dataset stabilize after 30-40 epochs, indicating the model’s performance has plateaued on the validation set.
Test Site and data description
The Trained model is tested in Barhabise, Nepal. Barhabise is situated along the Araniko Highway—a significant trade route linking Nepal and China. Characterized by fragile geology predominantly composed of sandstone and schist, coupled with the region’s steep mountainous terrain and heavy monsoon rainfall, this area stands out as a prominent landslide hotspot in the Himalayas.
Test data is prepared using pre-existing landslide inventory. The inventory was manually mapped from freely available optical satellite imagery, specifically Landsat and Sentinel-2 data. It encompasses a total of 129 landslides identified within the study area for the year 2018. For further details concerning the specific data used and the methods employed for landslide delineation, please refer to Rosser et al. ( 2012). The data is retrieved from NDRRMA through ICIMOD.
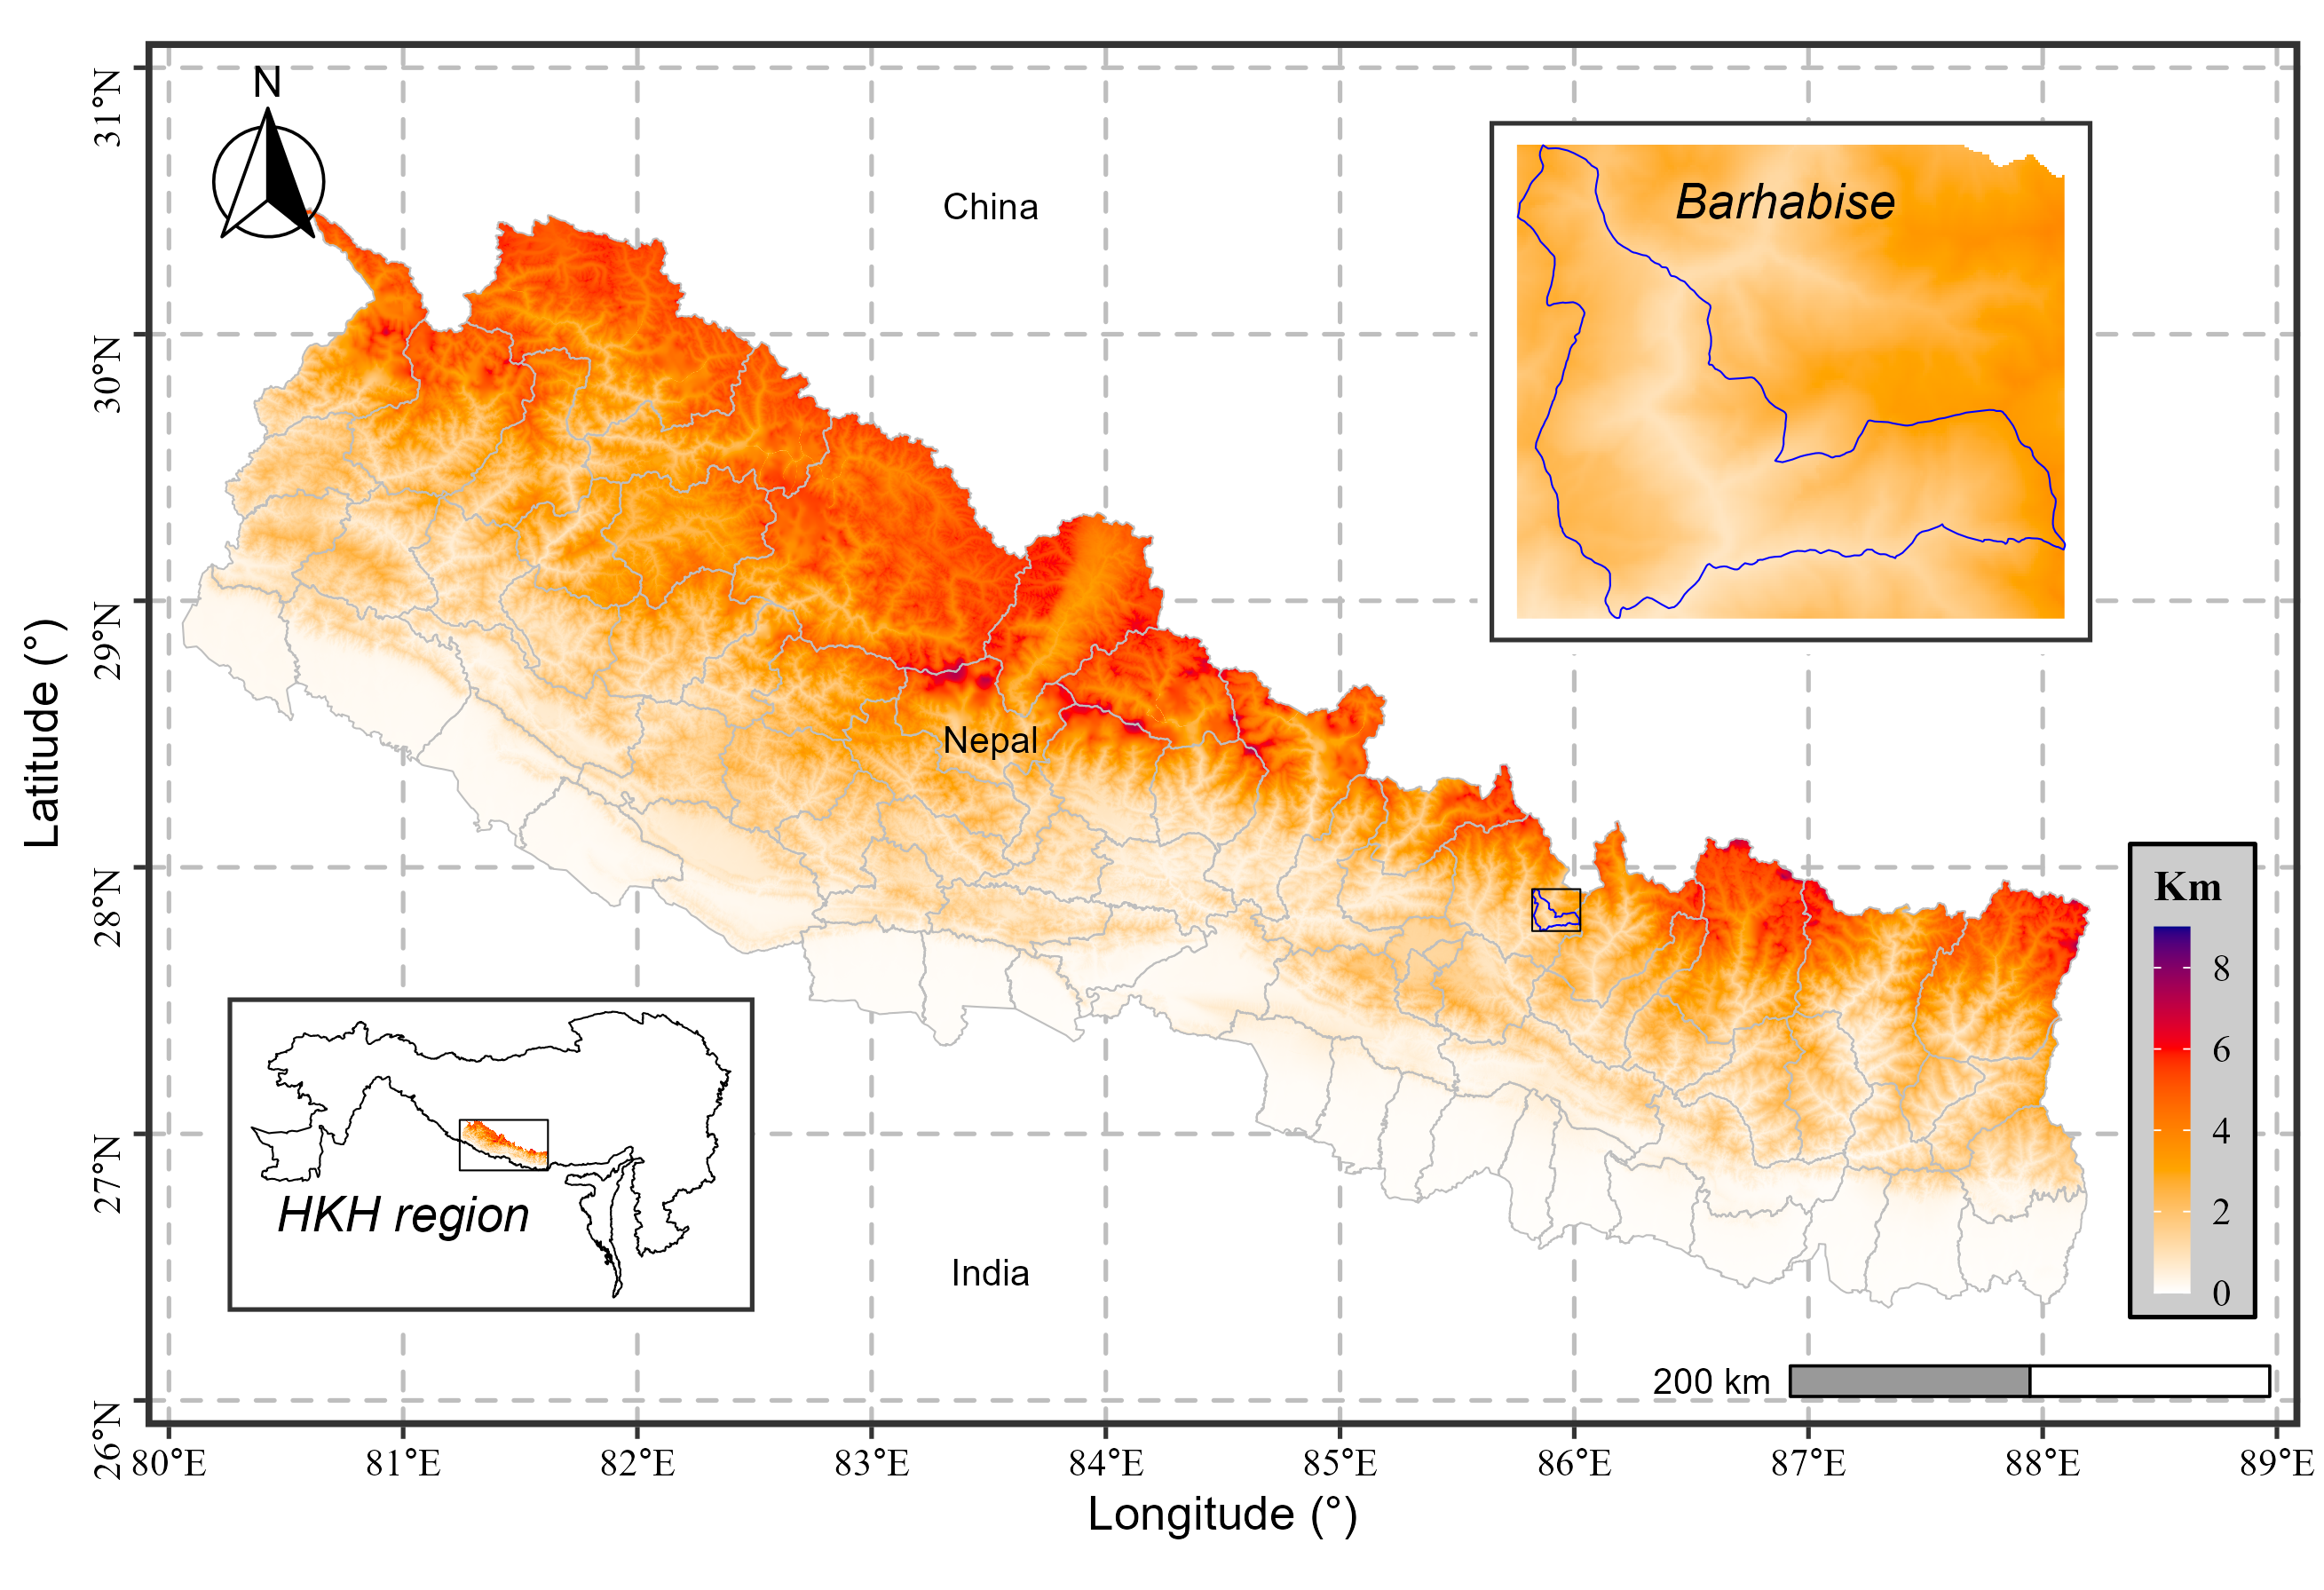
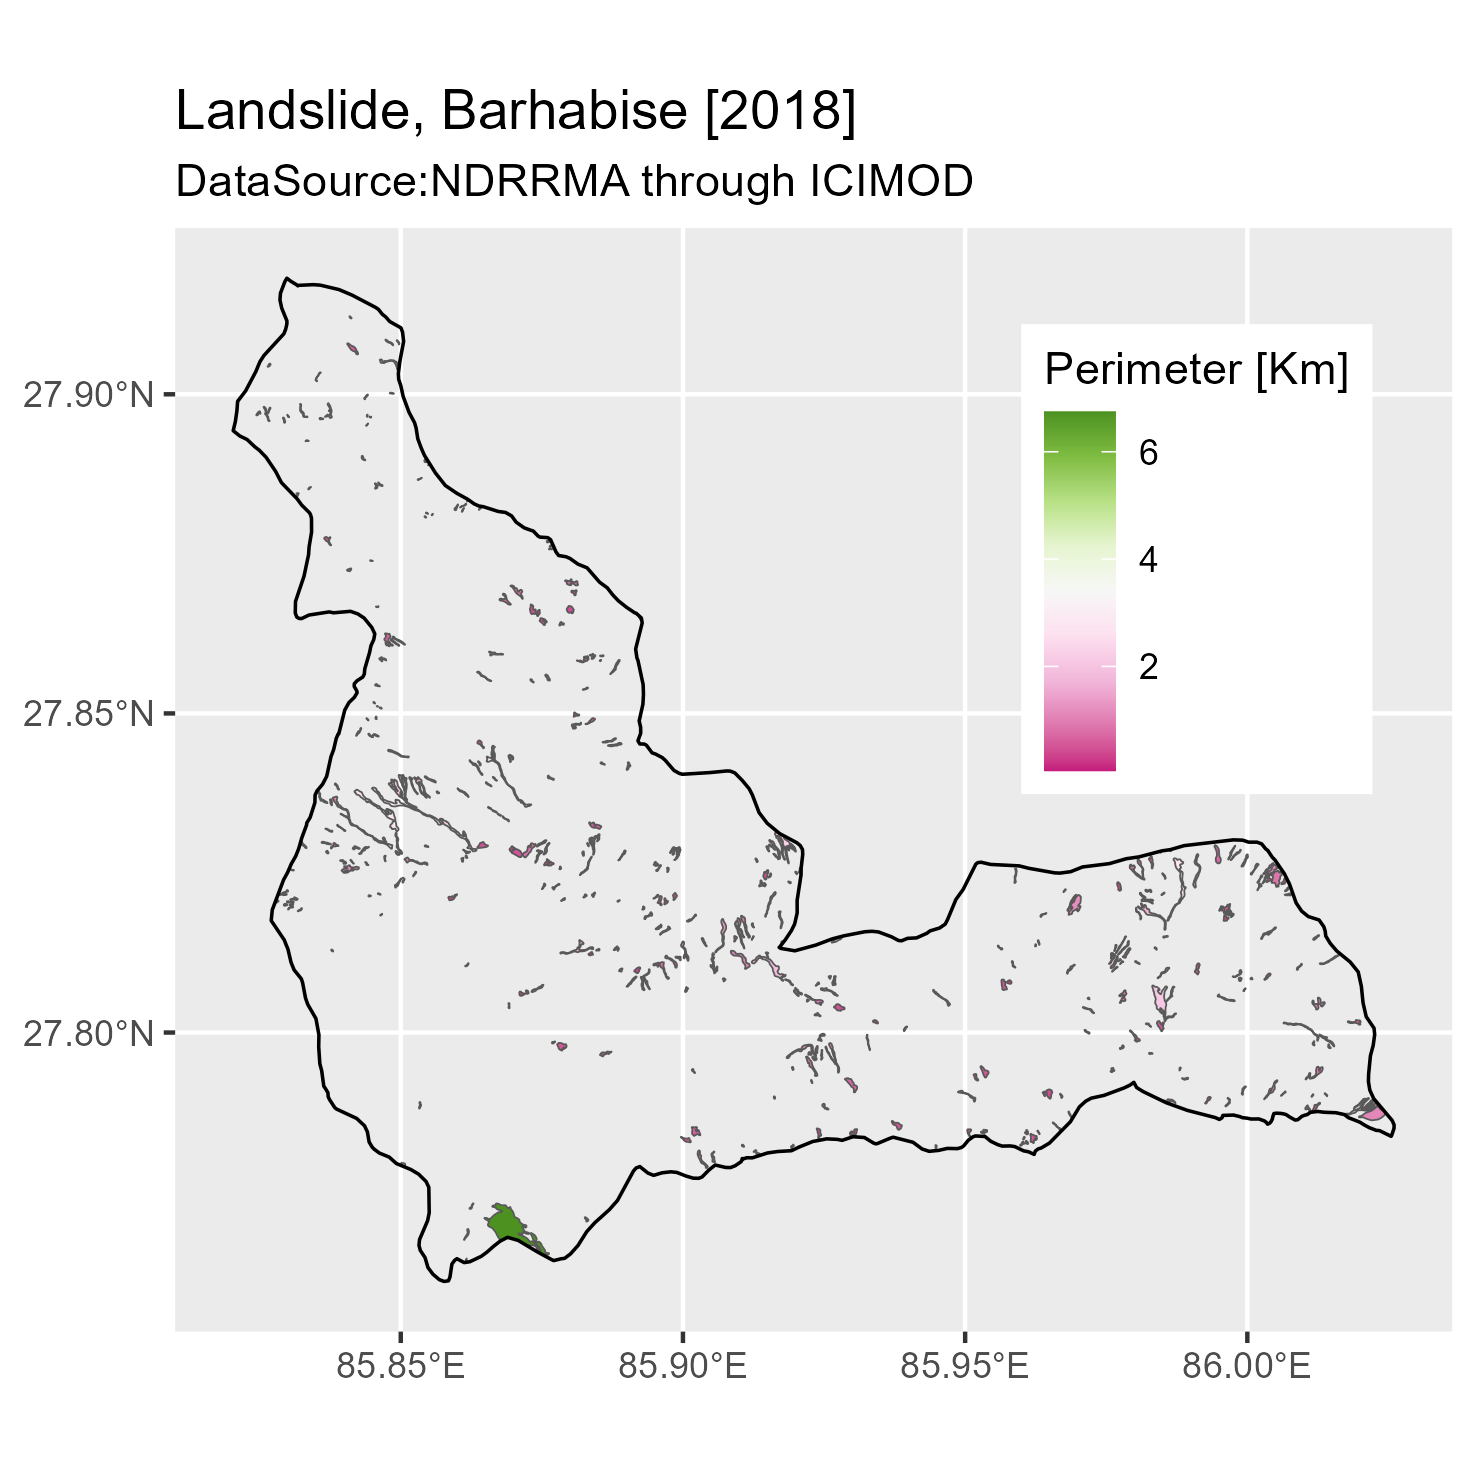
Figure 4: Test site location map with landslide inventory data from 2018.
Workflow for Test Site
The basic workflow for testing the model is shown in the following figure 5. A google Collab notebook is provided to get hands on experience with the test workflow at the end of this article. We first use an existing landslide inventory to pinpoint areas of interest and download relevant data (Sentinel-2 [RGB-NIR] and ALOS [Elevation and Slope]) from Google Earth Engine. To optimize processing efficiency, a bounding box is drawn around each landslide site, thereby minimizing the amount of data downloaded. The acquired data undergoes preprocessing to conform to the required training format, after which it is input into the model for prediction. Finally, we evaluate the model’s performance through both visual comparison with the landslide inventory (qualitative) and calculation of metrics (quantitative: precision, recall and f1-score) using a rasterized version of the inventory.
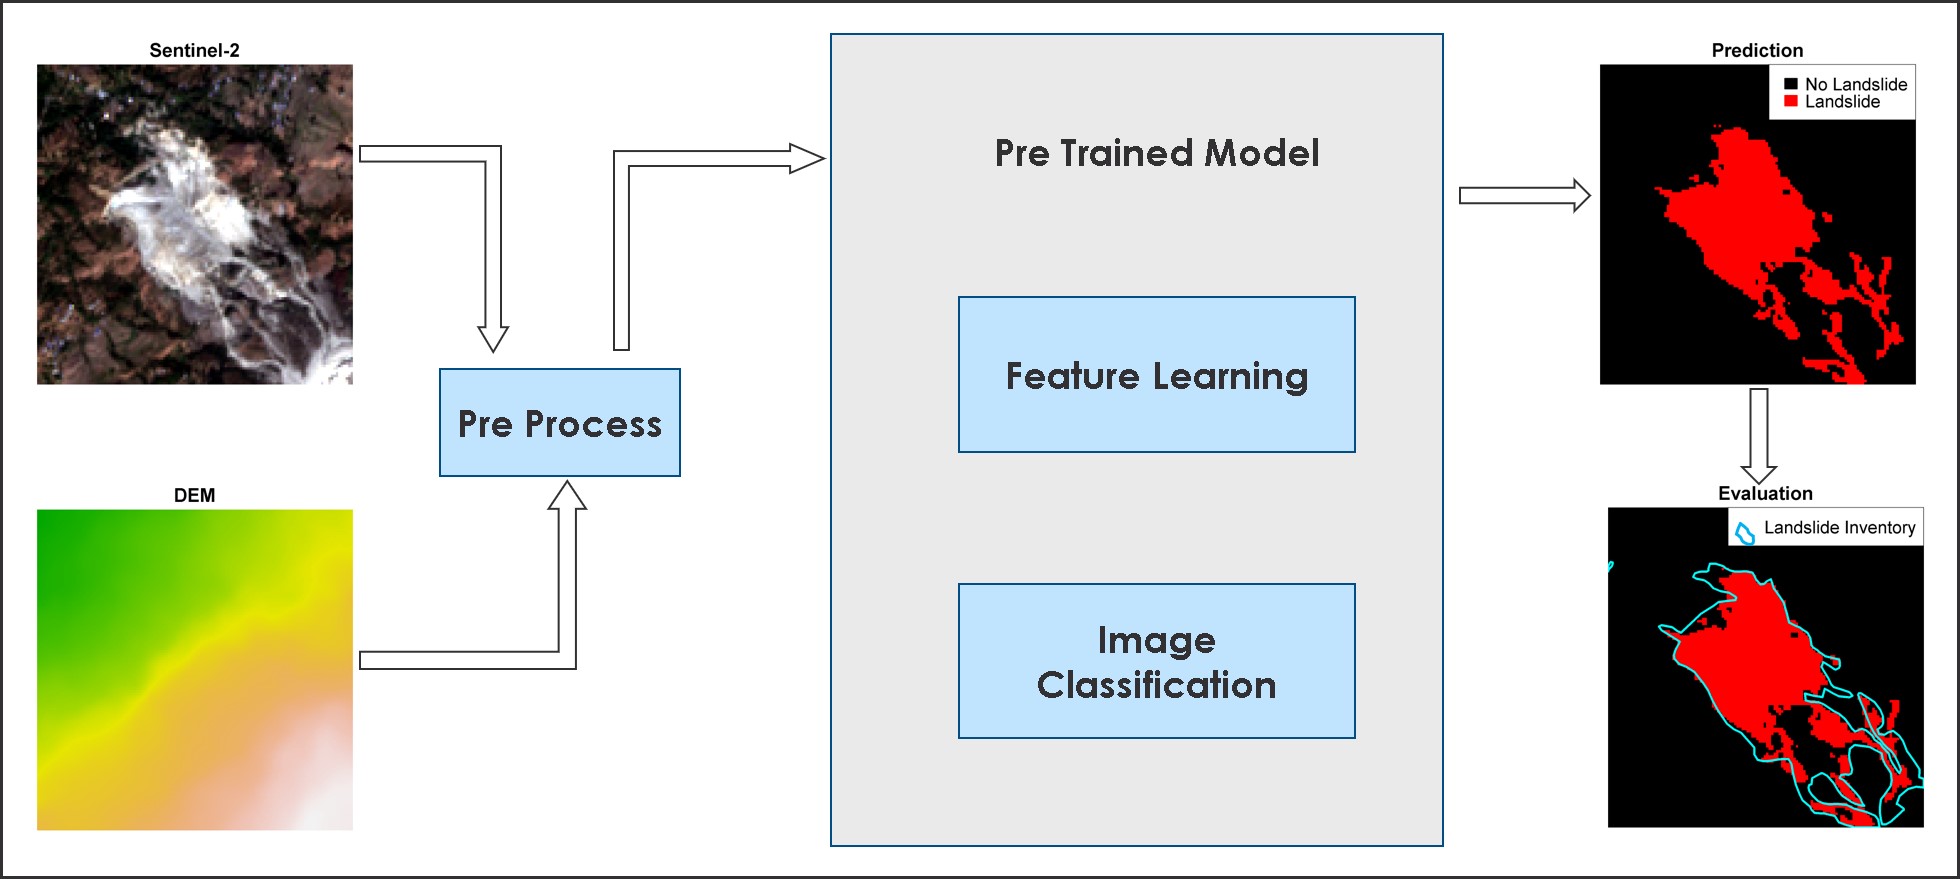
Figure 5: Workflow for deploying a pre-trained model in a new location.
Some Result
The comparison between predictions from the pretrained model and the rasterized landslide inventory is illustrated in the figure 6. The figure highlights predicted landslides that match the ground truth [blue], as well as those not identified by the model [green], and areas misclassified as landslides by the model [orange]. The model performs reasonably well in predicting large landslides, but it struggles with predicting smaller ones. Additionally, the model tends to overestimate landslide areas, classifying many regions as landslide zones when they are not. The animation in Figure 7 demonstrates the visual contrast details for each 128 by 128 tile alongside the input dataset.
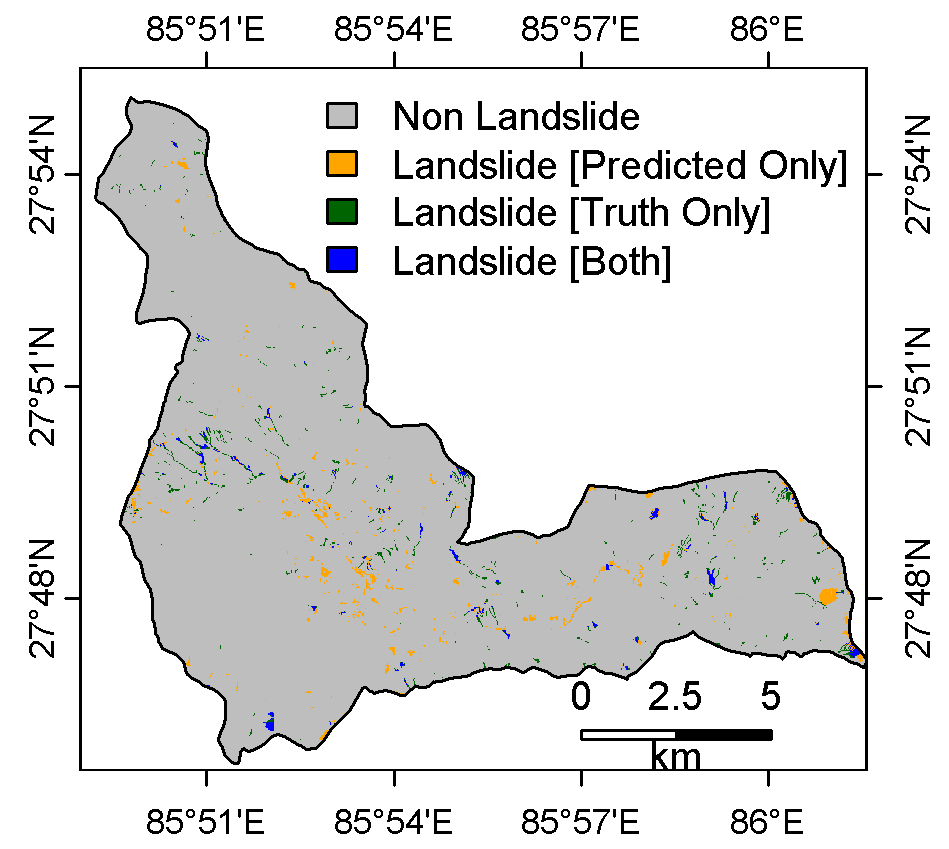
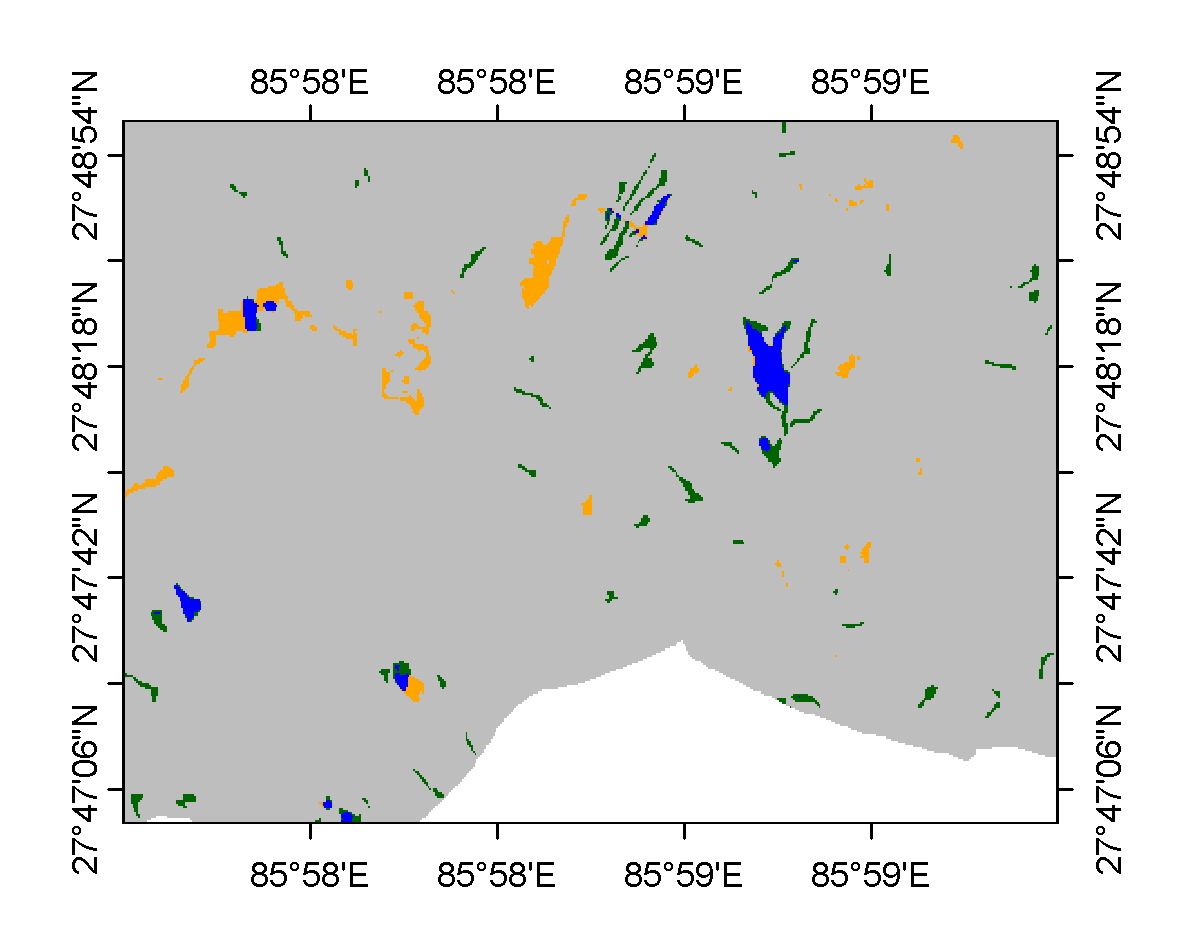
Figure 6: Comparison between landslide inventory and predicted landslides. A zoomed view of a subset is included for clearer visualization.
 Figure 7: Animation illustrates the input data, ground truth mask, and predicted extent for each of the 129 landslides analyzed during model testing.
The quantative evaluation revels that the precision of the model for unseen data is 27.51%, indicating that a small portion of the model’s predicted landslides is accurate. The recall is 34.81%, showing that the model identified only about a third of actual landslides. The F1 score, a balance of precision and recall, is 30.73%, reflecting moderate overall performance. Overall, the model has room for improvement, particularly in improving both its precision and recall.
Summary and Step Ahead
This study implemented a U-Net model for rapid landslide mapping in the Himalayas, capitalizing on a collaborative dataset. Data augmentation increased the validation data’s accuracy. However, applying the pre-trained model to unseen data in new locations exposed limitations in detecting smaller landslides, highlighting the complexities of landslide behavior.
Moving forward, we aim to refine the model by exploring various learning rates, epochs, and data augmentation methods to diversify the training data. Furthermore, incorporating additional spectral bands and delving into pre-trained models with extensive training data, such as VGG16, offer promising avenues for further development.
Predict Landslides in Your Area: A Hands-on Experience
Curious to see how our pre-trained model performs in identifying landslides for your region? We’ve created a Google Colab notebook – a free, cloud-based platform by Google that allows you to experiment with the workflow described here. All you need is a Gmail account and a Google Earth Engine (GEE) account.
This interactive notebook lets you define the location and date of a potential landslide. It then automatically:
Creates a bounding box around your chosen coordinates.

Downloads 128x128 pixel sized Sentinel-2 imagery and slope elevation derived from ALOS.

Runs a pre-trained landslide detection model hosted on Github.

Predict landslide.
Explore the Collab notebook and use it to map potential landslides in your area!
https://colab.research.google.com/drive/1ongKxC7rW8xbVFFsvSF2MV0G4tlyE8Qu?usp=sharing